Boost compressed 212M tokens from my agent sessions
I ran boost report this morning, mostly to see whether the thing was actually pulling its weight or whether I’d been carrying it around like a productivity tracker that quietly tells you what you want to hear. Here’s what came back, unedited:
~ boost report
Boost Report
Not in a git repository; showing data from all projects using Boost.

Boost compressed 212.0M tokens (63.4%) before they hit your context window.
I saved my team $1,060 across 964 conversations.
Estimated at $5.00 per 1M tokens.

Conversation Breakdown
30-minute inactivity split · top 5 by savings
┌────────┬───────────────────────────────┬──────────┬──────────────┬────────┐
│ CONVO  │ TITLE                         │ COMMANDS │ TOKENS SAVED │ EST. $ │
├────────┼───────────────────────────────┼──────────┼──────────────┼────────┤
│ #1     │ Agent Builder wizard step...  │ 85       │ 580.4K       │ $3     │
│ #2     │ Tool Builder Python codeg...  │ 67       │ 491.6K       │ $2     │
│ #3     │ Vertex AI Engine deploym...   │ 31       │ 308.8K       │ $2     │
│ #4     │ MCP server integration t...   │ 52       │ 274.0K       │ $1     │
│ #5     │ Langfuse traces for agen...   │ 18       │ 197.2K       │ $1     │
└────────┴───────────────────────────────┴──────────┴──────────────┴────────┘
212 million tokens is not a small number. Most of it was log noise, dependency-resolver chatter, ANSI color codes, and the kind of verbose progress output every CLI writes assuming a human is staring at the terminal. The agent doesn’t need any of it. Boost strips it out before it reaches the context window, which is why the percentage is what it is.
That’s one developer. Twelve of us on the JFrog CIO team have been running boost since we rolled it out, and the combined estimated savings sits around $9K (same $5/M assumption).
Here’s the Thing
- Boost wraps every command your coding agent runs (and every command you run in CI), then compresses the output before the agent or pipeline sees it. My personal report: 212M tokens compressed (63.4%), $1,060 saved, 964 sessions.
- One Go binary, three surfaces: terminal, agent hooks, CI. Same compressor, same cache, same OTel exporter everywhere.
- It’s free. Single install line, no signup. I work at JFrog and the FastCI team builds it, so take the cheerleading with the appropriate grain.
What boost actually is, the short version
Boost is a CLI wrapper. You prefix a command with boost (or let it auto-wrap via hooks), it executes the command for you, captures the output, compresses it, caches the result when it’s safe to, and emits an OpenTelemetry span describing what happened. That’s the whole shape. The thing it’s optimizing for is the gap between “what a CLI prints for a human” and “what an LLM agent or a CI log actually needs to understand the result.” That gap is enormous, and almost nobody measures it. Disclosure I should put up front: JFrog is my employer, and the team that builds boost (FastCI) sits two rooms from mine. I am not a neutral reviewer. I am, however, the guy whose own report shows 212M tokens compressed, so I’m at least an honest user.
What the 63.4% number actually compresses
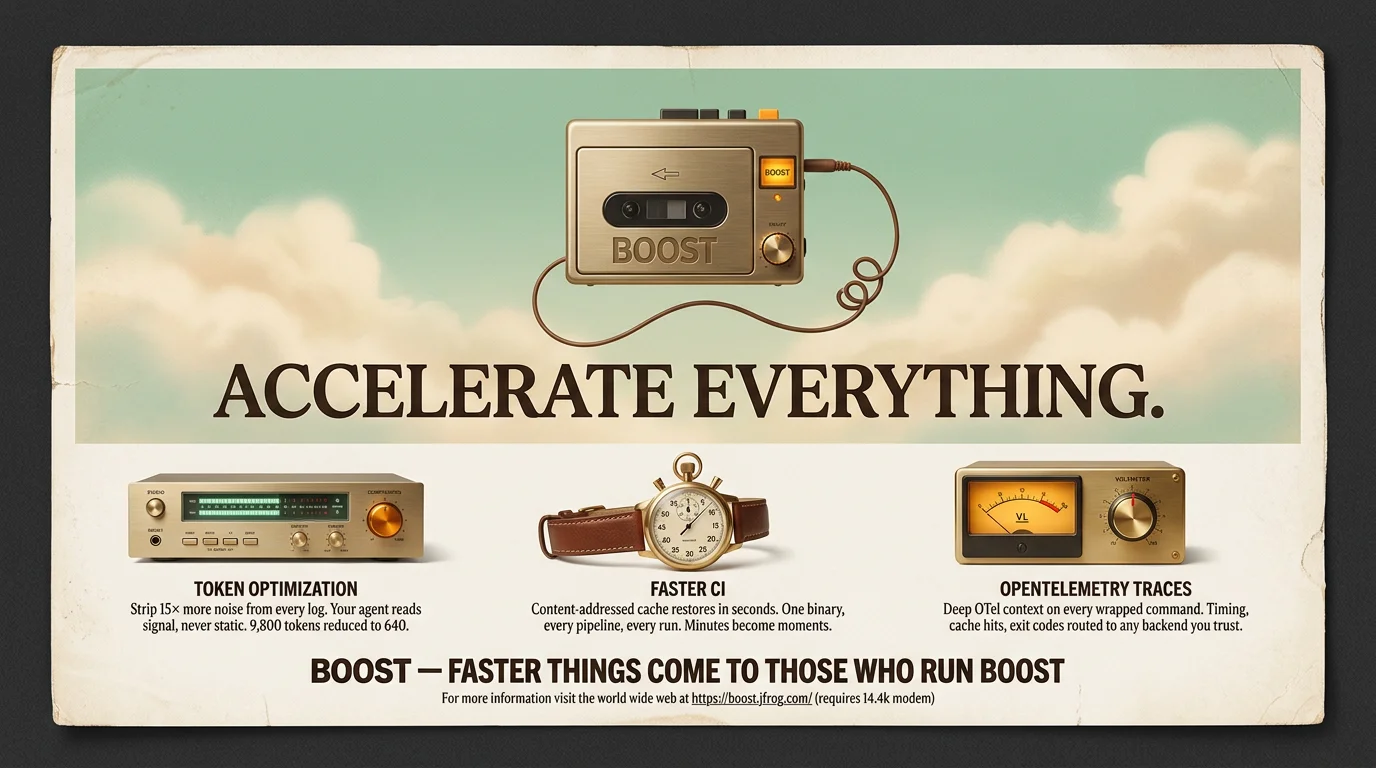
Here’s the example I keep showing people who ask what compression looks like in practice. Raw npm ci on a moderately sized project (about 1,300 packages) emits roughly 9,800 tokens of output: a per-package install line, deprecation notices, peer-dependency warnings repeated three times each, progress bars rendered as horizontal lines of equals signs, a funding pitch, and a vulnerability summary at the end. The agent reads every line, decides nothing useful from 9,400 of them, and you pay for all of it on the next turn when the transcript replays into context.
Boost replaces all of that with one line that looks something like this:
[OK] npm ci · 1,285 packages restored from boost cache in 2.4s · 0 vulnerabilitiesThat’s about 640 tokens after counting framing and the agent’s own attention to it. ~15× compression on a command the agent runs dozens of times a session. The compressor is tool-aware: it knows what npm ci output looks like, what’s load-bearing, and what’s decorative. There are similar handlers for pytest, docker build, gh run view, go build, terraform plan, and roughly a hundred other tools at this point.
Took me a few weeks to clock the second-order effect. Tokens are the obvious cost. The less obvious one is that the agent’s attention gets pulled toward whatever happens to be sitting in the noise. Reading 9,800 lines of mostly-identical install output gives a model more places to anchor on something irrelevant, and that shows up later in multi-step plans falling apart for reasons that don’t trace back to anything obvious. Strip the noise and the agent’s choices visibly tighten. I don’t have a benchmark for “tightness” but I can feel it in the failure rate.
The full README documents the before/after for several tools at github.com/jfrog/boost. The pattern is the same: keep the result, the duration, the count, the errors. Drop everything else.
How CI runs in seconds now, on the same binary
Pillar two is the cache. Boost computes a content-addressed key for each wrapped command based on the input files, lockfile, and relevant environment, then stores the side effects (extracted node_modules, compiled artifacts, downloaded layers) keyed on that hash. The next time anything in your fleet runs the same command with the same inputs, the cache restores instead of recomputing.
The honest before/after on the npm ci from earlier: cold install on a fresh runner was about 45 seconds. Second run, same lockfile, restored in 2.4 seconds. The cache lives wherever you configure it, locally by default, or in a managed backend if you’re on a paid plan (this is the only place the free/paid line shows up in normal use).
Took me a minute to internalize this: it’s the same binary. The same boost that wraps my terminal commands and gets auto-invoked by Claude Code hooks is what runs in CI. One implementation. No drift between your laptop and the pipeline because they’re literally running the same code. The wiring in GitHub Actions is a single step:
- uses: jfrog/boost@v0

- name: Install dependencies
  run: boost npm ci

- name: Test
  run: boost npm test
That’s it. The action installs the binary, every subsequent boost <command> step participates in the same cache and emits the same telemetry. Pinning to v0 follows the rolling-major convention; pin to a specific semver (e.g., v0.6.0) if your supply-chain policy requires it.
GitLab, Jenkins, CircleCI, and Azure Pipelines are listed as coming soon in the README. Today, GitHub Actions is the integration that’s actually shipped.
OpenTelemetry traces for every wrapped command
Pillar three is the part I find most underrated, because once it’s wired up you stop guessing what your agent is doing.
Every command boost wraps emits an OTLP span. The span carries the command name, duration, exit code, cache hit/miss, the working directory, and a handful of other attributes you’d actually want when debugging “why was that session slow” or “which step in CI is the long pole this week.” Set two environment variables and the spans go wherever you want:
export BOOST_OTEL_ENDPOINT="https://otlp.<your-collector>.com"
export BOOST_OTEL_TOKEN="<token>"
Or, if you prefer config files, the same goes in a [tracing] block in ~/.boost/config.toml. Any OTLP-compatible backend works: Datadog, Grafana, Honeycomb, New Relic, or a self-hosted OpenTelemetry collector. The wire format is standard OTLP, so this is not a “supports the three vendors that paid for an integration” situation, it’s just OTel.
A thing I want to flag, because it’s the part I’d want flagged if I were installing this on a work machine: boost ships a three-layer secret-redaction pipeline (env-var scan, Gitleaks regex pass, runtime-registered patterns), and it runs the redactor before anything is written to disk, surfaced to the agent, or pushed to your OTel collector. The mechanism is documented in the repo’s SECURITY.md. I read it the day I installed boost because the last time I trusted a “totally safe” telemetry pipeline I ended up finding a database password sitting in a Claude Code session file. The redaction layer here looks deliberate. It fails closed at the export boundary, which is the right default.
What I get out of having spans on every command: the boost report numbers up top are computed from this telemetry, but I can also query it directly. “Which test command was slowest in the last week” becomes a Honeycomb query, not a guess. “Did the cache hit rate drop after the last lockfile change” becomes a graph in Grafana. None of that exists when your CI logs are just a 50KB text file in S3.
Why this stopped feeling like a CLI
What flipped boost from “a thing I run sometimes” into “a thing I forget I’m running” was the agent hook integration. You run boost init, it scans your machine for installed editors and agents (Cursor, Claude Code, Codex CLI, Gemini CLI, Windsurf, Cline, OpenCode), and it wires hooks into each one so every command your agent runs is silently wrapped.
You don’t change your prompts. You don’t add boost to anything. The agent calls npm ci, the hook intercepts, boost runs underneath, the agent receives the compressed output. That’s the whole experience.
This is the part where the hook conversation I had a while back becomes relevant. Most hooks people write are guardrails (block a write, scrub a credential, refuse a session-end). Boost uses hooks as a transparent execution layer. Same primitive, different vector. It’s the most useful demonstration I’ve seen of why the hooks surface is undervalued: an entire product fits inside it, and your agent never knows the difference.
Re-run boost init whenever you add a new editor or CI provider. The hook registration is idempotent and merges into existing settings without clobbering what you’d already configured, which I confirmed by reading the diff on my own ~/.claude/settings.json after running it. I’d been bitten before by installers that obliterated my hand-tuned settings (the Ghostty tab-title rabbit hole started with one of those), so I check now.
What I’d flag before you install it
A few honest caveats, because this isn’t a pitch.
The $1,060 number assumes $5 per 1M tokens. Your actual cost depends on which model you’re paying for. If you’re on Haiku at $1.25/M output, divide. If you’re burning Opus at $25/M, multiply. The 212M-tokens-compressed number is the load-bearing one; the dollar figure is just an arithmetic layer on top.
The cache is local by default. That’s a feature, not a footgun, but it means the cache hit rate on a fresh CI runner is zero until you wire up the managed cache (paid) or roll your own shared backend. Local-only is the right default for security; it’s the wrong default if you expected zero-config “fast CI from minute one.”
Wrapping happens in your shell. Boost runs as your user, with your permissions. If you don’t trust the binary, don’t run it. If you do, the redaction and local-first telemetry posture are the parts I’d point at.
None of those are dealbreakers for me. Most of them are the kind of thing I’d want to know on day one, not the kind I’d find out on day thirty.
Frequently asked questions
What does boost actually do to my command output?
It captures stdout and stderr, runs a tool-aware compressor that strips noise (progress bars, repeated warnings, ANSI codes, per-item logs) while keeping the load-bearing information (result, duration, error messages, counts), and returns the compressed output to the caller. On npm ci the ratio is about 15× (9,800 tokens to ~640). Across my real usage it’s 63.4% reduction on average.
Is boost free?
Yes. The CLI is free with no signup, the GitHub Action is free, and the local cache and OTel export are free. There’s a managed cache acceleration tier on a paid plan if you want shared cache across a fleet; everything else works out of the box at zero cost.
Where does my data go?
Locally by default. Token-savings stats, command history, and OTel spans land in ~/.boost/ (or .boost/ inside CI runners). Nothing leaves your machine unless you set BOOST_OTEL_ENDPOINT to push spans to a collector, and even then the three-layer secret-redaction pipeline runs before export. The mechanism is in the SECURITY.md doc on GitHub.
Does it work with Cursor and Claude Code, or just one?
Both. boost init auto-detects installed editors and agents (Cursor, Claude Code, Codex CLI, Gemini CLI, Windsurf, Cline, OpenCode) and wires hooks into each one it finds. Same binary, same compression, same telemetry across all of them. Re-run boost init after installing a new editor.
What happens if the cache is wrong?
The cache key is content-addressed (input files, lockfile, relevant environment), so “wrong” usually means “you changed an input boost didn’t realize was load-bearing.” You can bypass the cache for any individual command with the appropriate flag, or boost cache clear to nuke it entirely and rebuild. I’ve hit one stale-cache moment in three months of daily use and it took about ten seconds to clear.
Where I landed
The 212M-tokens-compressed number is real, the $1,060 savings is real (with the $5/M caveat), and the 63.4% rate is what I get on a working agent setup that mixes CI runs, agent sessions, and ad-hoc terminal use. None of those numbers required any tuning on my end. I ran boost init once, let the hooks wire themselves, and went back to work.
Install line, for the curious:
curl -sSfL https://boost.jfrog.com/install.sh | bashAfter that, boost init in your project root, and the next agent session is the one where you start seeing the difference. Docs and the rest of the surface area live at boost.jfrog.com and the repo is at github.com/jfrog/boost.
If you’ve been writing your own hooks to scrub agent context (the post on hooks covers the lay of that land), boost is the version of that idea taken to its logical end: don’t scrub after the fact, compress at the boundary, and emit the telemetry while you’re there. The thing that surprised me, after running it for a while, is how much of “agent reliability” is just signal-to-noise.